A scientific look at what vaccination does
Friday, October 29th, 2021With all the misinformation around, people don’t know what to believe. Here’s what hard numbers will show you (even though anti-vaxxers will not know how to handle this knowledge):
Fact: https://coronadashboard.rijksoverheid.nl/landelijk/positief-geteste-mensen
Scroll a bit down for a nice map of the Netherlands, with the amount of COVID infections per 100.000 residents
Another fact: https://coronadashboard.rijksoverheid.nl/landelijk/vaccinaties
Scroll a bit down for another nice map, now with vaccinations per 100.000 residents.
Now, how to accent both maps to show something interesting? Take the Infection map. Put an INVERTED vaccination map on top. Make the top layer LIGHTEN the lower layer. It means, the more vaccinated areas will do LESS now to the final picture. The LESS vaccinated areas will AFFECT the more infected areas more. The infected areas were mostly dark blue, so you didn’t see anything particularly interesting.
Take a look at the final picture:
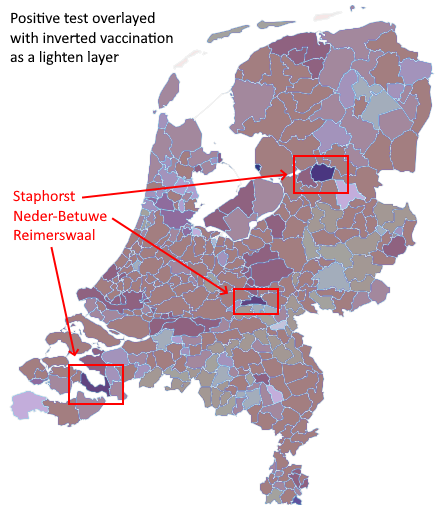
Now, go back to the live infections page and the vaccination page, and look for those 3 marked areas. Look at the number it returns, and the numbers around it. The numbers are extremely clear. Only a few less points of vaccination coverage, and a clear massive higher infection rate. Draw your own conclusions!